behind_the_scenes_of the fuzzy work
The design process of the interactive visual essay that explores public data of tech layoffs between 2020 and 2025.
Background
As we enter the 5th year since COVID-19, the world feels a lot different than what it was before. Many people left their previous jobs, either voluntarily or involuntarily, to pursue something different in life, including myself. Having worked in the tech industry for most of my career, I’m intrigued by the shifting landscape of this industry. The dataset from layoffs.fyi that tracks tech layoff announcements reported by major news outlets, became a starting point for this analysis.
Analysis & Exploration
When I receive a dataset, my first step is to understand the broader context implied by the labels used in the dataset. After initial research and scoping, I decided not to focus on the announcement dates or geographic locations. Instead, I treated the 5-year period as a cohesive whole, aiming to uncover shifts in industries and startups during this unique turning point of history.
To do this, I first looked into the funding stages. By consolidating the original 15 funding stage labels into six broader categories, I made the dataset more digestible and more relevant for comparative analysis.
And then I aggregated the layoff announcements by company and explored correlations across different sectors.
const layoffByCompany = Array.from(
	rollup(
		layoffData,
		(v) => {
			const totalLayoff = sum(v, d => d.layoff);
			const maxPercent = max(v, d => parseFloat(d.percentage));
			const { stage, industry } = v[0];
			return {
				layoff: totalLayoff,
				percentage: maxPercent,
				stage: simplifyStage(v[0].stage),
				industry,
				events: v.map((d) => {
					return {
						date: d.date,
						layoff: d.layoff,
						percentage: d.percentage,
						location: d.location,
						country: d.country
					}
				})
			};
		},
		(d) => d.company
	),
	([company, values]) => ({ company, ...values })
);
I use ObservableHQ to prototype the data transformation, and build interative charts for explorative analysis.
Much of my early exploration revolved around forming hypotheses and testing them quickly. For
instance, I initially suspected that the amount of funds raised by a company might correlate
with the scale of layoffs—but this idea didn’t hold up, so I excluded the funds_raised column in the final visualization. Instead, I found that the funding stage of a company offered
more meaningful patterns.
Heuristic Consideration for UX
Out of the dozens of exploratory charts I created during the ideation phase, I selected five to feature in the final essay. These were chosen not just for insight, but for how they guide a general audience through the topic with increasing complexity.
The piece opens with a bold word cloud as the hero image—offering a visceral, immediate impression of the content to follow.
The first two charts are straightforward bar charts with minimal interactivity, allowing readers to quickly grasp the core focus of the essay and build a foundational understanding of the dataset.
Next comes a heatmap that maps industry sectors against funding stages. This adds dimensionality, helping readers spot patterns and priming them for the final visualization.
The closing chart is a highly interactive beeswarm plot that puts the data in the reader’s hands. With tools to filter, slice, and clamp the data, readers can explore layoff distributions on their own terms. This final moment invites interpretation, encouraging each reader to draw their own conclusions.
Although I personally prefer brighter, more playful color palettes, I chose a dark color scheme for this piece to suit the subject matter. The essay is meant to evoke a mood of grim reflection and invite the reader into a more somber contemplation.
Reflections
I was curious about how layoffs affected different industries, so I spent considerable time researching the companies tagged under each industry label. It quickly became clear that these categories functioned more like a loose taxonomy than strict definitions. To reflect this ambiguity, I annotated all 30 industries in the dataset with a relativity score—ranging from 0 ("not related at all") to 2 ("strongly related").
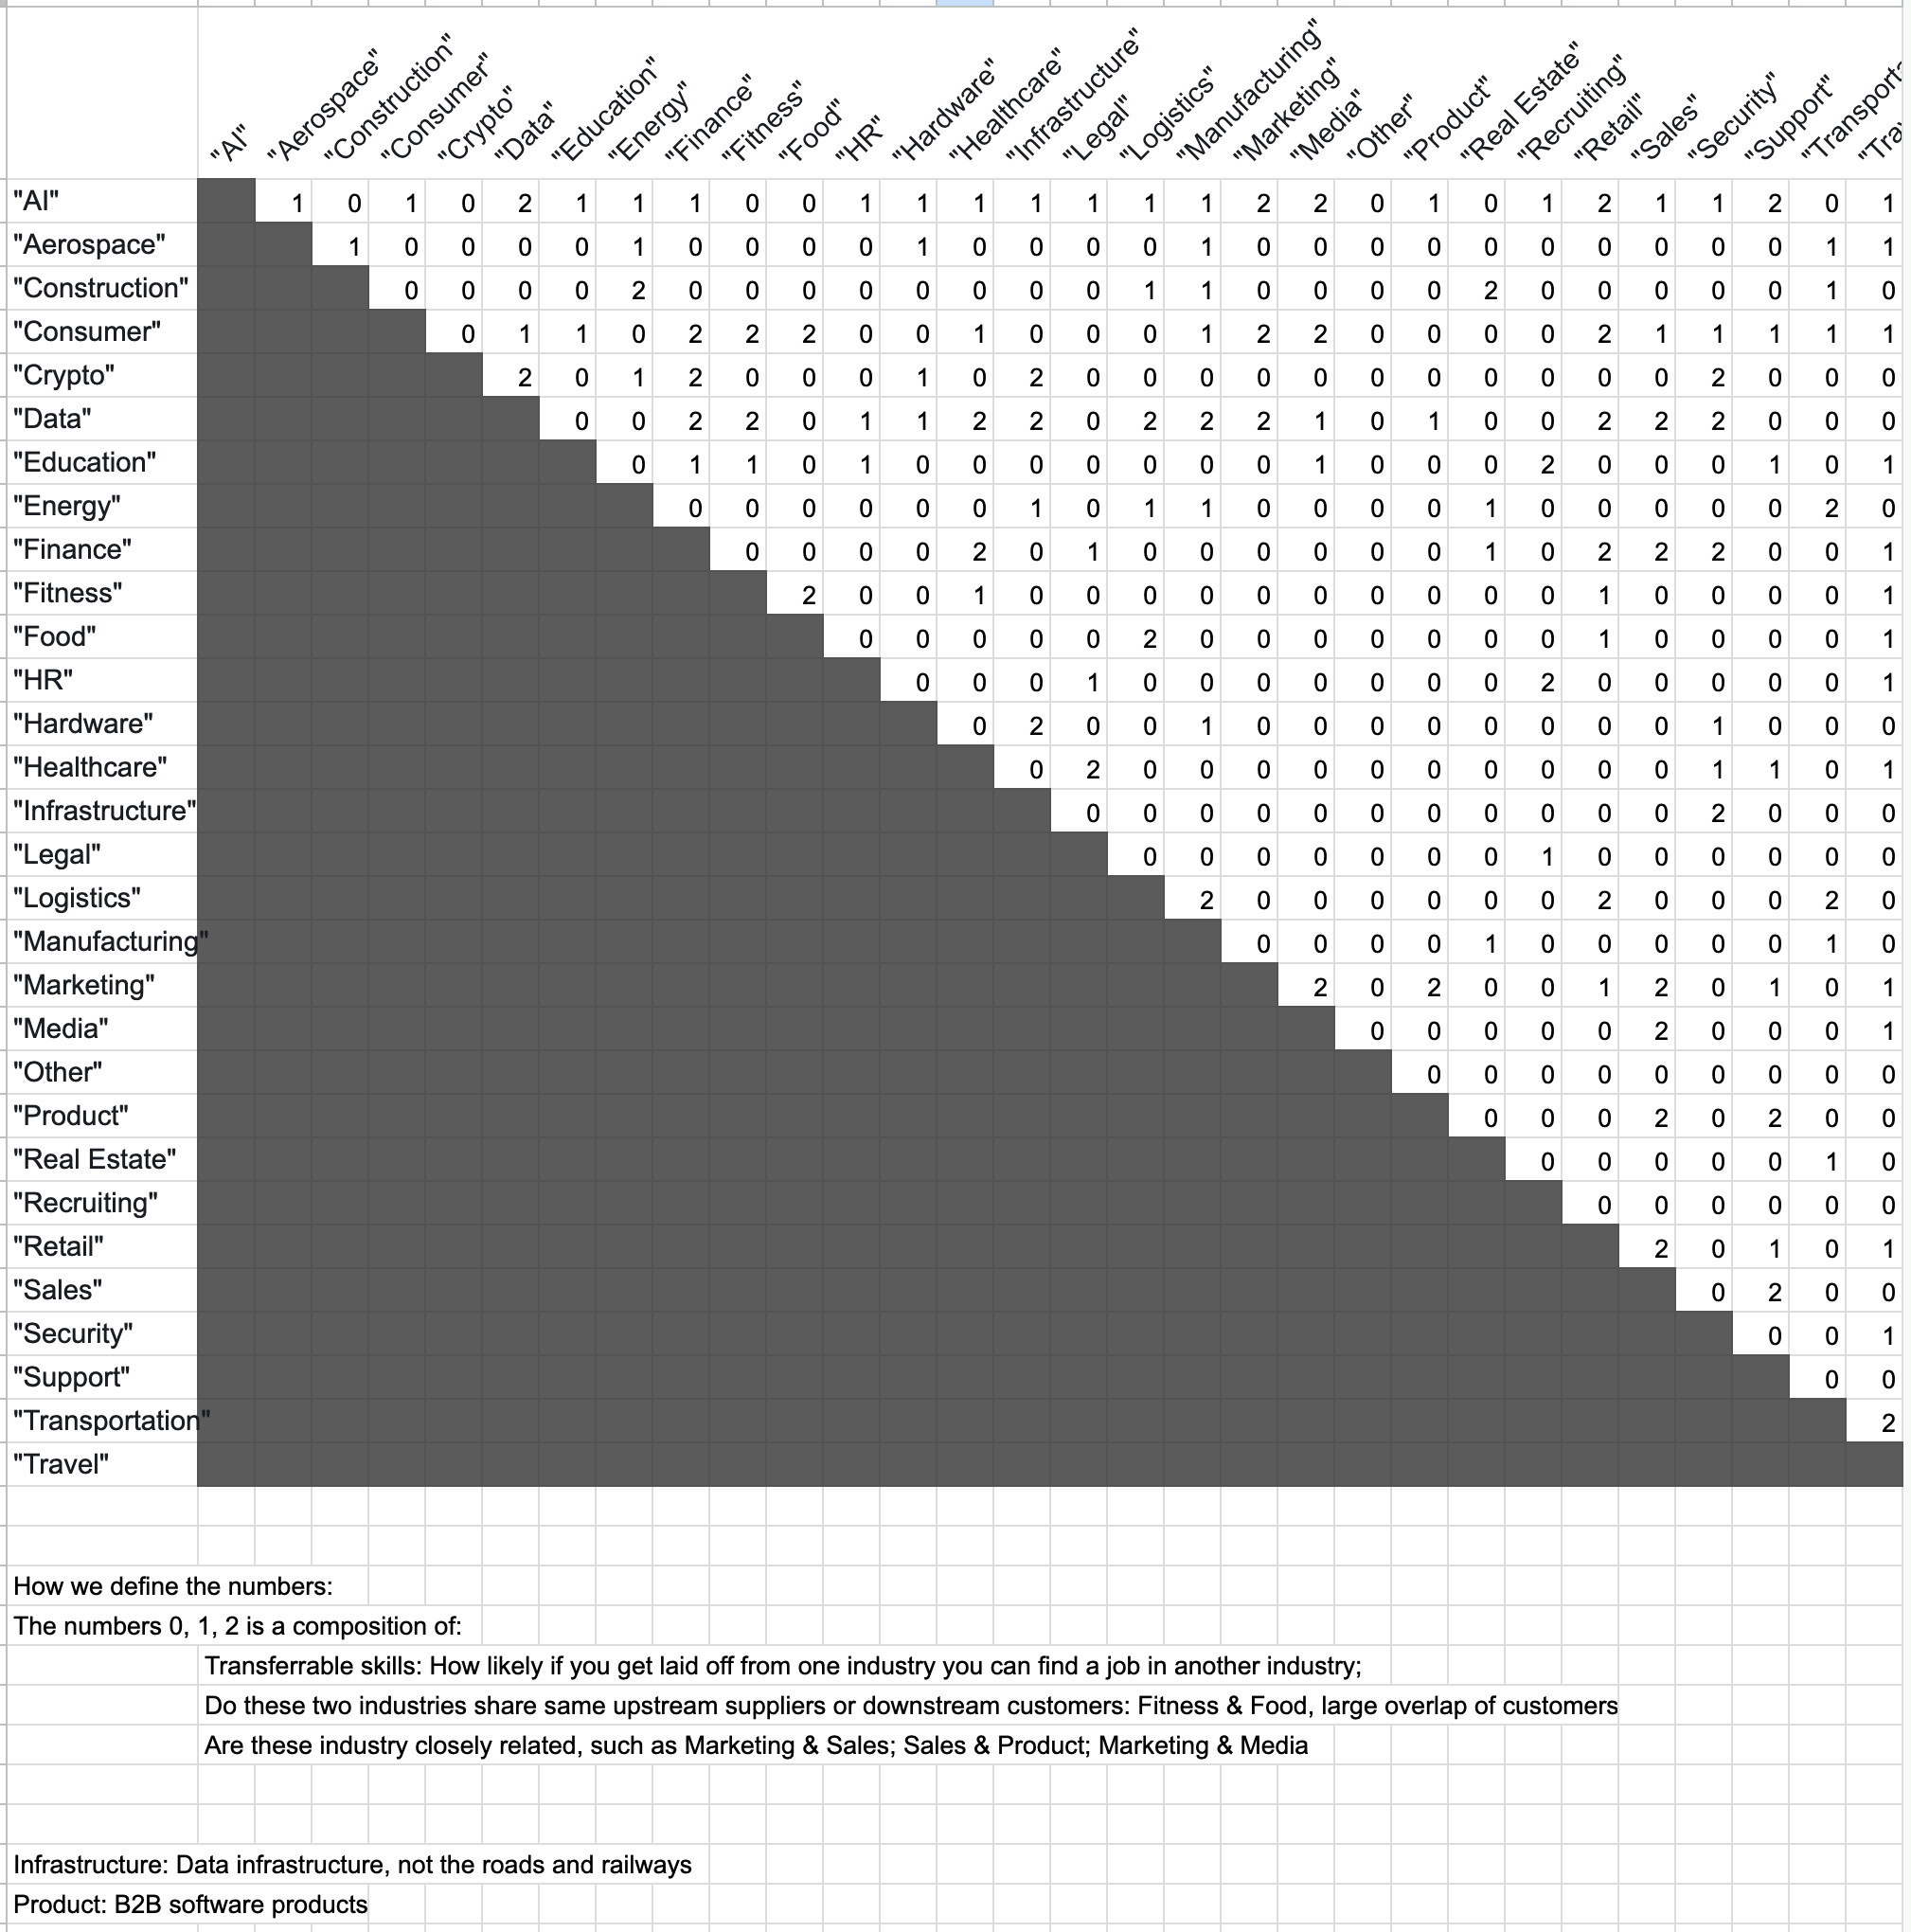
I then reimagined these industry labels as a network graph. 👇
In my initial implementation, this graph wasn’t just decorative—it doubled as a filter UI for the beeswarm chart. But user testing revealed it was too confusing to navigate. So I pivoted to a simpler, more familiar solution: checkboxes.
In the end, the taxonomy graph found its place as the hero image of the article.
Check out the article The Fuzzy Work - 2020~2025: the nebulous shift of the tech industry.
Acknowledgement
I could not have done this work without the generous support from Data Visualization Society. The idea was first developed at a Future Fridays workshop, led by Rudi O'Reilly Meehan and Martina Zunica. The final product was completed under the DVS Mentorshop Program, advised by Anastasia Stevens and Brian Rouse. Check out the video presentation: